What Node-RED adds to your observatory
Node-RED is a visual programming tool built on Node.js that lets you connect hardware, APIs and services using a browser-based flow editor. For observatory use, it acts as a lightweight automation layer that can read sensor data, make decisions, control equipment and display a dashboard, all without writing traditional code.
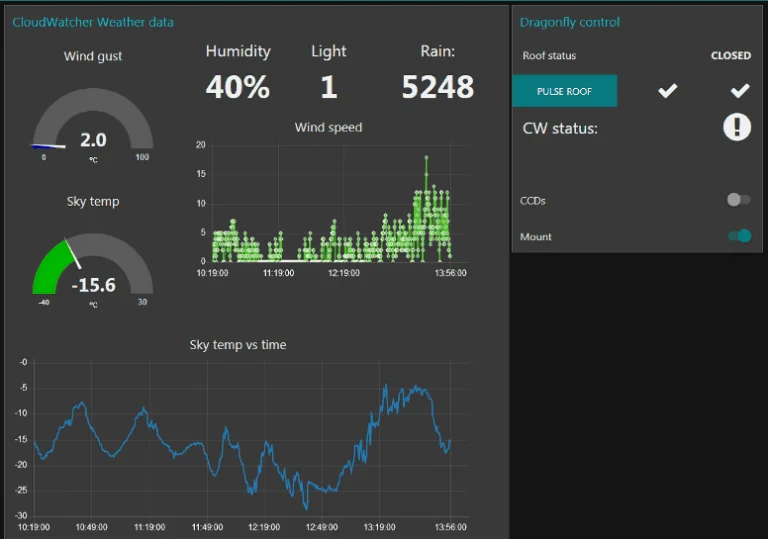
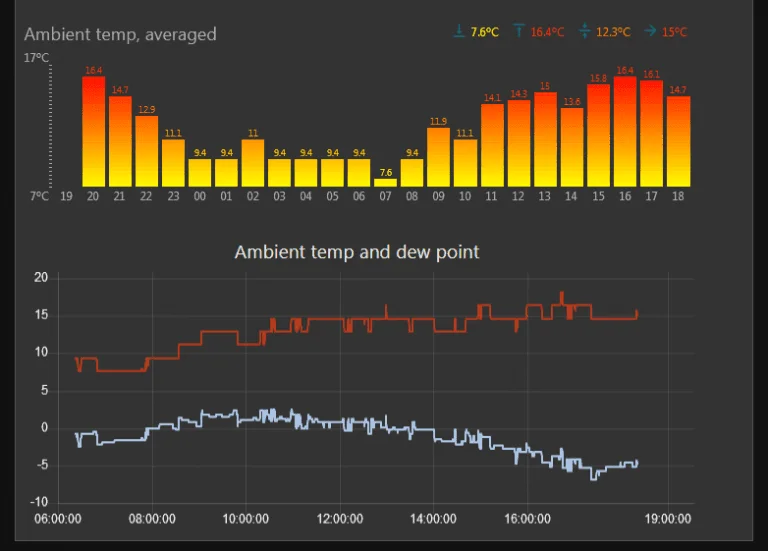
The Lunatico-developed flows connect to both the Dragonfly controller and the CloudWatcher SOLO over the network, visualise weather data in real time, and provide buttons to control power outputs and the roof relay.
Installing Node-RED
Follow the official installation instructions at nodered.org for your platform (Raspberry Pi, Windows or Linux). Then install the required additional packages:
npm install node-red-dashboard
npm install node-red-contrib-dashboard-average-bars
Launch Node-RED and open the flow editor in your browser at http://localhost:1880.
CloudWatcher SOLO integration
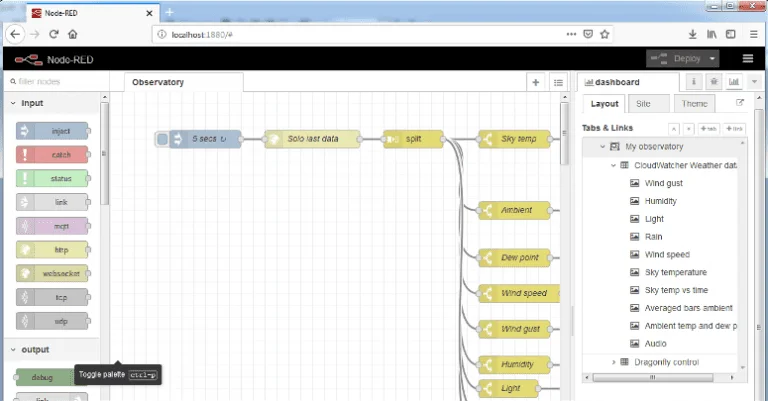
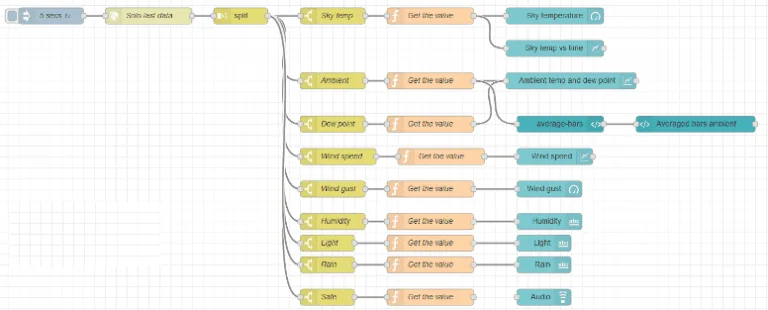
The SOLO exposes its data via a simple HTTP endpoint. The flow polls this endpoint every 30 seconds and parses the response into individual sensor channels.
Data available from the SOLO
The flow endpoint to poll: http://aagsolo/cgi-bin/cgiLastData (replace aagsolo with your device hostname or IP).
Within the flow, switch nodes filter specific parameters and function nodes extract numeric values. The data feeds into dashboard gauge and graph nodes for real-time visualisation.
Dragonfly control integration
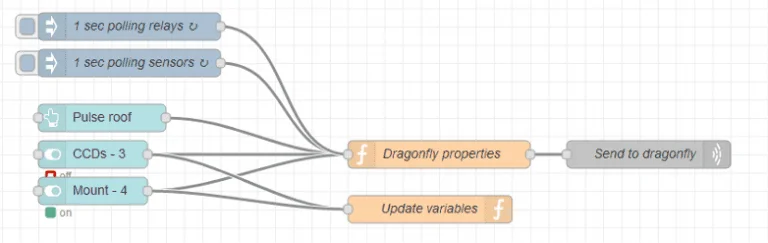
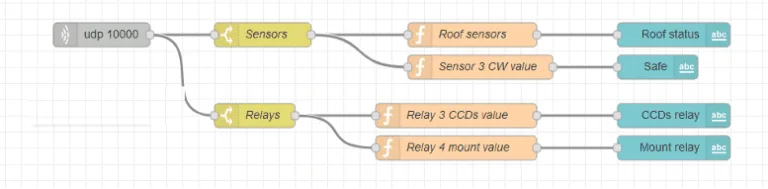
The Dragonfly communicates via UDP on the local network. The Node-RED flow sends command packets and listens for status responses, creating a two-way control interface.
What you can control
- CCD camera power (on/off)
- Mount power (on/off)
- Roof open / close (relay pulse)
- Custom output labels
What you can monitor
- Real-time roof status
- Safety relay status
- Command execution state
- Error warnings
The dashboard shows visual indicators: a spinning icon while a command is executing, a checkmark when confirmed. Commanded vs. actual state are compared and flagged if they diverge.
The complete flow file—ready to import into Node-RED—is available for download below. It's a good starting point for customisation: the Lunatico team acknowledges there is room to improve colour coding and icons, and welcomes contributions from the community.
Node-RED flow file
Import-ready JSON—Dragonfly + SOLO dashboard with roof and power control